Lovable analytics: built-in, Google Analytics or events?
Lovable’s built-in analytics shows visits and sources, not what users do. Compare it with Google Analytics and cookieless event tracking (video, 38 s).
Sep 27, 2026 · 4 min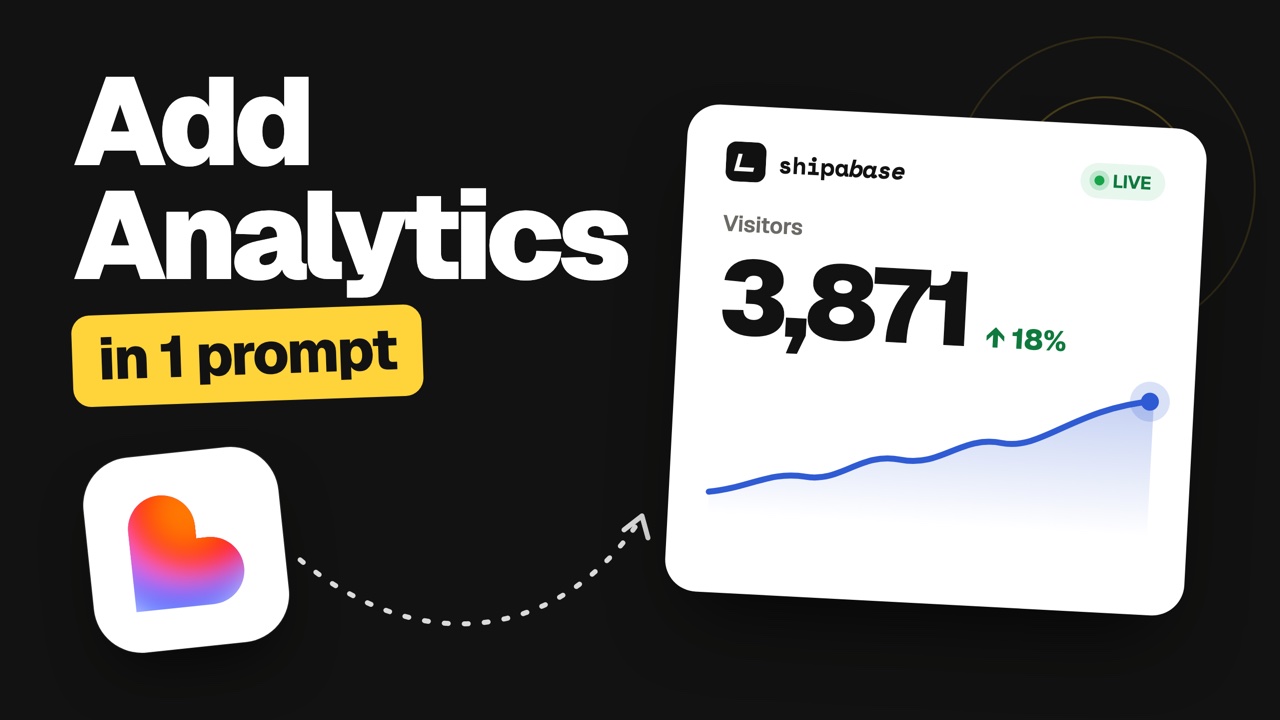
Short answer: Lovable analytics tells you how many people visited your app and where they came from. To see what they do (sign up, create something, pay), add an event tracking tool. The video below does it in one prompt, in 38 seconds.
What Lovable’s built-in analytics tracks#
Every published Lovable project collects traffic stats automatically. Open them from More → Analytics in the editor toolbar. There is nothing to install.
| Metric | What it means |
|---|---|
| Visits | Browsing sessions, not people: one person on two devices counts twice |
| Page views | Pages opened, in total and per visit |
| Duration, bounce rate | How long visits last, and how many leave after one page |
| Source | The site that sent the visit: a search engine, a social network, or Direct |
| Page, device, country | Top pages, desktop / mobile / tablet, and country (from the browser’s timezone) |
Tracking is on by default. You can turn it off in Project settings → General → Publishing → Visitor analytics.
Where Lovable analytics stops#
- No actions. It counts visits to your signup page, not how many people signed up.
- No campaigns. It doesn’t read UTM parameters, so you can’t compare two launch posts or two newsletters.
- No funnels. You can’t see where people drop between your landing page and your payment page.
- AI assistants hidden in Direct. Visits from ChatGPT or Perplexity only show up as a source when the browser sends a referrer, which often doesn’t happen (see why AI traffic shows up as direct).
It’s enough to check that a launch brought people. It’s not enough to know whether your app works for them.
Google Analytics in Lovable#
Lovable has a Google Analytics connector: open Connectors → Google Analytics, paste your measurement ID (G-…) and connect. Your app then loads gtag.js and sends page views, including client-side route changes, plus custom events and conversions.
Google Analytics sets cookies in your visitors’ browsers. In the EU and the UK you need a consent banner before it loads, and visitors who refuse aren’t counted.
GA4 is powerful, but it’s a lot of product for a small app: reports to set up, events to mark as key events, and numbers that arrive hours later.
Event tracking with Shipabase, in one prompt#
Shipabase is product analytics for apps built with AI. It adds what Lovable’s dashboard doesn’t have, with no cookies and no personal data. This is what the video shows:
- 1
Create an app and copy your key
In Shipabase, create an app and copy its public key (
SB-EU-…) from the Setup page. The key can only write events, so it’s safe in browser code. - 2
Ask Lovable to add Shipabase
Paste this in Lovable’s chat, with your key:
Prompt for Lovable Add Shipabase analytics to this app with the @shipabase/js package.My app key is SB-EU-xxxxxxxxxx. Follow https://shipabase.dev/llms.txt exactly.Lovable reads the instructions, installs the package, calls
initonce when the app starts and adds events for your key actions. - 3
Open your app and watch it live
Visit your published app: page views are tracked automatically, and your first visitor appears in the Live view within seconds.
For the Vite and TanStack Start code, preview visits and the events to track first, see the full guide: how to add analytics to a Lovable app.
Lovable analytics vs Google Analytics vs Shipabase#
| Lovable built-in | Google Analytics 4 | Shipabase | |
|---|---|---|---|
| Setup | None, on by default | Connector + measurement ID | One prompt |
| Page views and sources | Yes | Yes | Yes |
| Custom events (signup, payment) | No | Yes | Yes |
| UTM campaigns | No | Yes | Yes |
| AI assistants as a source | Only with a referrer | Mixed with referrals | ChatGPT, Perplexity, Claude, Gemini, Copilot labeled |
| Live view | No | Realtime report | Yes |
| Cookies / consent banner | Not documented | Cookies, banner needed in the EU | No cookies, no banner for the SDK |
| Ask your coding agent for stats | No | No | Yes, MCP server |
Which one should you use?#
- Just launched, want a pulse: Lovable’s built-in analytics is enough.
- Already on Google Analytics elsewhere, fine with a cookie banner: use Lovable’s GA connector.
- Want to know what users do, without a banner: add Shipabase. You can keep Lovable’s dashboard on at the same time.
What to track first in a Lovable app#
Start with 5 to 10 real actions, named object_verb in the past tense: signup_completed, project_created, checkout_completed. Props describe the action (plan, count, method), never the person: no emails, names or user IDs.
FAQ
Does Lovable have built-in analytics?
Yes. Every published project shows visits, page views, visit duration, bounce rate, sources, pages, devices and countries under More → Analytics. It is on by default.
Can Lovable analytics track signups or button clicks?
No. It counts visits and page views only. To count actions like signups or payments, add Google Analytics custom events or an event tracking tool such as Shipabase.
How do I see who visits my Lovable app?
You can see how many visits you get and where they come from, not who the visitors are. Privacy-first tools, Lovable’s and Shipabase included, count visitors without identifying them.
Do I need a cookie banner for analytics in a Lovable app?
For Google Analytics, yes in the EU and the UK, because it sets cookies. The Shipabase SDK stores nothing in the browser (no cookies, no localStorage), so it doesn’t need one.
Can I use Lovable analytics and Shipabase together?
Yes. They don’t conflict: keep Lovable’s dashboard for a quick look and use Shipabase for events, campaigns and funnels.
Does it work for apps built with Bolt, v0 or Replit?
Yes. They generate React or Next.js apps: the same one-prompt setup works. See the framework guides in the docs.

 Lovable
 Bolt
Bolt